

MD&A · 2025
In this section4 topics
Overview of Operations
Overview of Operations
Driving Business for Sustainability
"Balancing Economic, Social, and Environmental Dimensions toward a Sustainable Organization"
The Company is committed to enhancing operations by adhering to corporate governance principles and considering social and environmental impacts alongside economic development. The Group has established directions and guidelines to balance three main pillars (ESG) to drive the Company toward becoming a sustainable organization in the long term, as follows:
Environmental: Focuses on eco-friendly business operations, reducing greenhouse gas emissions, and efficient resource utilization. Key practices include adopting the Circular Economy and the 3Rs (Reduce, Reuse, Recycle) for waste management, along with campaigns to reduce paper and electricity consumption within the office.
Social: Prioritizes treating employees with respect for human rights and non-discrimination, while ensuring a safe working environment. This includes promoting the development of personnel knowledge and potential, as well as enhancing the quality of life for communities and society through innovation and technology knowledge sharing.
Governance and Economic: Emphasizes adherence to good corporate governance and ethics, while opposing all forms of corruption. The Company prioritizes product and service development for maximum customer satisfaction, including maintaining cybersecurity and personal data protection (PDPA), which are the foundations of digital business.
The Company has integrated sustainability into its business strategy, considering stakeholders throughout the entire Value Chain from upstream to downstream. To address expectations and respond to needs effectively, the Company has identified key stakeholder groups (such as employees, customers, partners, compliance regulatory, end customer, etc.).
These strategies are driven to support the United Nations Sustainable Development Goals (SDGs) and to enhance competitiveness in facing future business challenges.
Business Overview
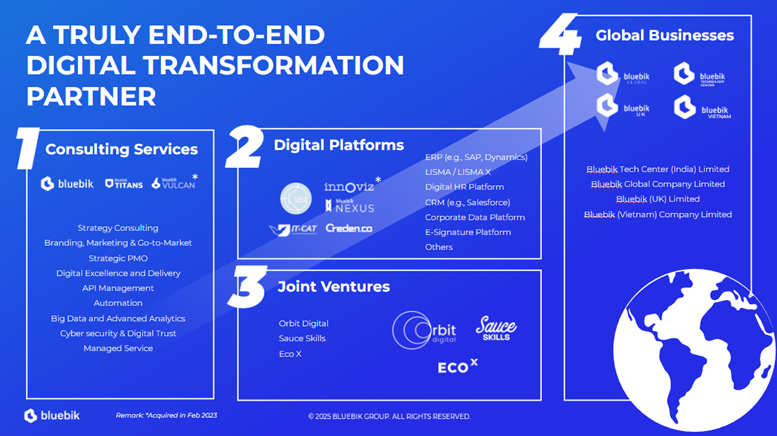
Bluebik Group Public Company Limited (“the Company”) provides comprehensive, end-to-end digital transformation consulting services. The Company focuses on utilizing digital technology as a critical tool for business development to maximize organizational benefits for clients ranging from small to large enterprises. The Group's operations are conducted through the Company, its subsidiaries, associates, and joint ventures (collectively referred to as “the Group”), categorized into four main areas:
Digital Transformation Consulting Services
This is the Group's primary business segment, providing a full suite of services. The Group emphasizes service quality alongside the expansion of new business models, particularly in technology trends essential for organizations after their digital transition. The core service offerings are as follows:
Management Consulting (MC): Focused on designing short-term and long-term (3–5 years) business strategies, including marketing plans for client products or services. This also covers market research for competitive strategy, process design to reduce redundancy, and organizational restructuring to align with business goals
Strategic PMO (PMO): Provides project management services through project governance, management mechanisms, and product administration. This ensures that clients can complete operations on time and achieve their set objectives.
Digital Excellence and Delivery (DX): Offers in-depth, comprehensive digital consulting and the development of appropriate technologies for organizations. This covers system architecture design, User Experience and User Interface (UX/UI) design for websites or applications, IT system development and improvement, and program integration to solve specific internal problems and increase business agility.
Big Data, Advanced Analytics, and Artificial Intelligence (AI): Provides design and development services for big data management systems, including data analysis and AI development to support decision-making and create competitive advantages.
IT Staff Augmentation: Serves as a provider of specialized IT personnel, such as programmers and software developers, to work on projects for specified durations until completion.
Cyber Security and Solution Implementation Services: Offers comprehensive cybersecurity management consulting, ranging from strategy and framework planning to assessment of control and prevention measures. This also includes enhancing security measures, planning for and responding to cyber threats, and installing cybersecurity systems for clients.
Digital Platform
The Group collaborates with leading global IT business partners to offer digital platforms and IT solutions that address emerging business needs and trends. These offerings expand the Group’s client base to cover enterprises of all sizes, facilitating digital transformation and modern business trends. Examples of these services include:
Enterprise Resource Planning (ERP) Development and Efficiency Enhancement (ERP Maximization and Advisory): The Group currently provides services for Microsoft Dynamics 365 and SAP systems. The focus is on designing and developing advanced business applications to enable clients to operate their ERP systems with maximum agility and efficiency
Customer Relationship Management (CRM) Development (CRM Advisory and Solution): Services are currently offered for the Salesforce system, spanning design, development, and maintenance. The emphasis is on creating systems that integrate seamlessly with a client’s existing infrastructure to enhance ease of use.
Furthermore, the Group develops proprietary digital platforms and IT solutions, such as the LISMA and LISMA X innovations. These innovations connect SAP systems with platforms like Line or Microsoft, enabling clients to utilize various systems with greater convenience, simplicity, and security.
Joint Ventures
The Group invests in joint ventures with strong and specialized business partners to expand its service offerings and business reach, including:
Orbit Digital Company Limited: A joint venture between the Company and Modulus Venture Company Limited, a subsidiary of PTT Oil and Retail Business Public Company Limited (“OR”). This entity provides consulting, design, development, and maintenance services for systems and applications within the OR Group, including data monetization to leverage organizational data for business expansion.
Sauce Skills Company Limited (“Sauce Skills”): A collaboration with The Standard Company Limited to operate a corporate training business. The venture aims to enhance digital and business skills and promote leadership within organizations. Sauce Skills is recognized as a subsidiary in the Company’s consolidated financial statements.
Eco X Company Limited (“EcoX”): A joint venture with Beryl 8 Plus Public Company Limited. The Company operates in the field of Green Technology, focusing on environmental technology and innovation.
Global Businesses
The Group continues to aggressively expand into large-scale international markets with high demand for digital transformation. We provide digital system development and technology consulting services to international clients in markets such as Indonesia, Singapore, the United Kingdom, and Vietnam. Our competitive edge is driven by the high potential of our digital personnel and a cost-advantage strategy that remains highly competitive on the global stage.
Key Milestone
The Company’s listing on the Stock Exchange of Thailand (SET) within the Technology industry group, Information and Communication Technology (ICT) sector, on July 22, 2025, represents a significant key milestone. This achievement reflects the robustness of the Group's infrastructure and corporate governance. Furthermore, the listing serves to increase stock liquidity and attracts both domestic and international institutional investors who prioritize investment in companies with high growth potential.
Operating Results & Financial Condition
Operating Results & Profitability
4.1.1 Analysis of Operating Results
Economic Overview
In 2025, the global and Thai economies remained in a state of "Volatile Recovery". Thailand's Gross Domestic Product (GDP) grew by approximately 2.5% – 2.8%, according to reports from the National Economic and Social Development Council (NESDC) and the Bank of Thailand. This growth was primarily driven by a continuous recovery in tourism and private consumption. However, persistent high household debt and uncertainty in international trade policies continued to pressure the export sector, forcing businesses to adjust strategies to maintain competitiveness and profitability.
Under these challenging macroeconomic conditions, Digital Transformation shifted from an "option for growth" to a "Survival Strategy" for large organizations. This was particularly evident in core target industries such as banking, insurance, and energy, which prioritized cost efficiency through the application of Artificial Intelligence (AI) and a full-scale Cloud Transformation.
Furthermore, the e-Conomy SEA 2025 report by Google, Temasek, and Bain & Company highlighted that Thailand’s digital economy continued its rapid growth, reaching a Gross Merchandise Value (GMV) of over 50 billion USD. Consequently, demand for specialized technology consultants in areas such as AI Consulting, Cybersecurity, and Enterprise Resource Planning (ERP) significantly exceeded market supply. These positive factors served as major drivers enabling the Group to expand its service base and maintain strong revenue growth despite macroeconomic uncertainties.
Performance Overview for the Year Ended December 31, 2025
Item Description | 2025 | 2024 | Change | |||
Million THB | % | Million THB | % | Million THB | % | |
Revenue from Services | 1,545.28 | 100.00% | 1,506.66 | 100.00% | 38.62 | 2.56% |
Cost of Services | (772.44) | -49.99% | (786.27) | -52.19% | 13.83 | -1.76% |
Gross Profit | 772.84 | 50.01% | 720.39 | 47.81% | 52.45 | 7.28% |
Other Income | 4.87 | 0.32% | 5.21 | 0.35% | (0.34) | -6.53% |
Selling and Administrative Expenses | (462.46) | -29.93% | (441.32) | -29.29% | (21.14) | 4.79% |
Operating Profit | 315.25 | 20.40% | 284.28 | 18.87% | 30.97 | 10.89% |
Finance Income | 5.43 | 0.35% | 4.58 | 0.30% | 0.85 | 18.56% |
Finance Costs | (6.84) | -0.44% | (7.08) | -0.47% | 0.24 | -3.39% |
Share of Profit from Associates and JVs | 57.86 | 3.74% | 66.77 | 4.43% | (8.91) | -13.34% |
Profit Before Income Tax | 371.70 | 24.05% | 348.55 | 23.13% | 23.15 | 6.64% |
Income Tax Expense | (24.41) | -1.58% | (34.72) | -2.30% | 10.31 | -29.69% |
Net Profit | 347.29 | 22.47% | 313.83 | 20.83% | 33.46 | 10.66% |
Non-controlling Interests | 6.56 | 0.42% | 12.72 | 0.84% | (6.16) | -48.43% |
Net Profit Attributable to Parent | 340.73 | 22.05% | 301.11 | 19.99% | 39.62 | 13.16% |
The Group continued to deliver exceptional performance, achieving a new record high:
Revenue from Services:Total revenue reached 1,545.28 million THB, representing an increase of 38.62 million THB or a growth of 2.56% from the previous year (2024: 1,506.66 million THB). The primary revenue drivers were services in the Digital Excellence & Delivery segment and AI-Led Enterprise Transformation, which emerged as the year's significant mega-trend.
Cost Management and Gross Profit:The Company successfully managed its human resources and leveraged its subsidiaries effectively, resulting in a cost of services of 772.44 million THB. This led to a Gross Profit of 772.84 million THB, representing a robust Gross Profit Margin of 50.01%.
Net Profitability:Total Net Profit stood at 347.29 million THB, an increase of 10.66% year-on-year. Net Profit attributable to the parent company reached 340.73 million THB, achieving significant growth of 13.16% from the previous year (2024: 301.11 million THB)
These results reflect not only quantitative growth but also the potential for Margin Expansion amidst intensifying competition. The Company maintained high profitability by delivering high-value services and operating under an efficient synergy model within the Group. In addition to strong growth in 2025, the Company significantly maintained its ability to secure new projects and extend contracts with its existing client base. Consequently, as of December 31, 2025, the Group’s total Backlog stood at 838 million THB (excluding backlogs from joint ventures and associates). Of this total, at least 663 million THB is expected to be delivered and recognized as revenue in 2026, with the remainder recognized during 2027–2030, ensuring revenue continuity and business stability in the coming years.
Revenue from Services
Revenue by Segment | 2025 | 2024 | Change | |||
Million THB | % | Million THB | % | Million THB | % | |
1. Management Consulting (MC)* | 157.64 | 10.20% | 86.11 | 5.72% | 71.53 | 83.07% |
2. Strategic PMO | 19.91 | 1.29% | 17.35 | 1.15% | 2.56 | 14.76% |
3. Digital Excellence & Delivery (DX)** | 1,272.11 | 82.32% | 1,320.79 | 87.66% | (48.68) | -3.69% |
4. Big Data & AI | 95.62 | 6.19% | 82.41 | 5.47% | 13.21 | 16.03% |
Total Revenue from Services | 1,545.28 | 100.00% | 1,506.66 | 100.00% | 38.62 | 2.56% |
* Includes Sauce Skills Corporate Training
** Includes Innoviz, Vulcan, ERP, CRM, and Cyber security
For the fiscal year 2025, the Group’s total revenue from services reached 1,545.28 million THB, an increase of 38.62 million THB or 2.56% from 1,506.66 million THB in 2024. This growth was driven by the sustained demand for full-scale digital transformation, particularly the surging adoption of Artificial Intelligence (AI) and data to build competitive advantages. Consequently, specialized consulting segments experienced remarkable growth. Specifically, Management Consulting (MC) revenue surged by 83.07%, rising from 86.11 million THB to 157.64 million THB. Furthermore, amidst the Global Digital Talent Gap, the Corporate Training business under Sauce Skills became a key strategic driver, nearly doubling its profit to 9.90 million THB by helping clients re-skill and up-skill their workforce to keep pace with rapid technological changes. This growth occurred alongside the Big Data and AI segment, which expanded by 16.03% to 95.62 million THB, and the Strategic PMO segment, which grew by 14.76% to 19.91 million THB. These figures reflect strong client confidence in the Group’s ability to provide strategic direction and apply advanced technologies to meet business objectives
Conversely, revenue from Digital Excellence and Delivery (DX) - which includes ERP, CRM, and Cyber Security - stood at 1,272.11 million THB, a decrease of 48.68 million THB or 3.69% from 1,320.79 million THB in the previous year. The primary cause for this decline was the organizational restructure, where certain employees were transferred directly to a joint venture. This transfer resulted in a reduction of billable secondment revenue from that specific group, impacting total revenue by approximately 9%. However, this decrease did not negatively affect the Company's overall profitability, as associated costs were reduced in a similar proportion. Despite this personnel-related structural adjustment, DX remains a core pillar of the Group’s growth, accounting for 82.32% of total service revenue. The exponential growth in the Strategy (MC) and Data (AI) segments this year highlights a shifting Service Cycle, where clients are increasingly focused on establishing new strategic foundations and further integrating AI innovations. This trend reaffirms the Group's strength as an End-to-End Digital Transformation Partner capable of sustainably addressing market demands at every stage of the transformation journey.
Other Income and Gains
Item Description | 2025 | 2024 | Change | |||
Million THB | % | Million THB | % | Million THB | % | |
Dividend income | 1.47 | 2.34% | 0.42 | 0.58% | 1.05 | 250.00% |
Share of profit of associates and JVs | 57.86 | 92.24% | 66.77 | 92.77% | (8.91) | -13.34% |
Other income* | 3.40 | 5.42% | 4.79 | 6.65% | (1.39) | -29.02% |
Total | 62.73 | 100.00% | 71.98 | 100.00% | (9.25) | -12.85% |
* Other Income consists of income from services provided to related companies and other miscellaneous income.
For the fiscal year 2025, the Group’s total other income - comprising dividend income, share of profit of associates and joint ventures, and other income - totaled 62.73 million THB. This reflects a decrease of 9.25 million THB or 12.85% compared to 2024, which recorded 71.98 million THB. Detailed changes are as follows:
Dividend Income: This was the most significantly growing category within this group. In 2025, dividend income reached 1.47 million THB, an increase of 1.05 million THB or 250.00% from the 0.42 million THB recorded in the previous year. The primary driver for this exponential growth was the dividend income derived from investments in other non-current financial assets, reflecting the efficiency of the Company's cash management and investment allocation.
Share of Profit from Investments in Associates and Joint Ventures: While this item saw an accounting decrease to 57.86 million THB (a decline of 8.91 million THB or 13.34% from 66.77 million THB in 2024), the actual cash return remained strong. Specifically, the joint venture (Orbit Digital Company Limited) distributed a dividend to the Group totaling 28.94 million THB, a substantial increase from 15.84 million THB in the prior year. This reflects the robust liquidity of the joint venture. This category remains the largest component of other income, representing 92.24% of the total.
Other Income: (Consisting of service income from related companies and other miscellaneous income) was 3.40 million THB, a decrease of 1.39 million THB or 29.02% year-on-year.
Overall, the 12.86% decrease in total other income was primarily due to the structural accounting decline in the share of profit of associates and joint ventures (the major component) and a reduction in miscellaneous other income. Nevertheless, the significant growth in dividend income serves as a positive indicator of the Company’s long-term financial asset management capabilities.
Costs and Expenses
Cost of Services
Item Description | 2025 | 2024 | Change | |
Million THB | Million THB | Million THB | % | |
Revenue from Services | 1,545.28 | 1,506.66 | 38.62 | 2.56% |
Cost of Services | (772.44) | (786.27) | 13.83 | -1.76% |
Gross Profit | 772.84 | 720.39 | 52.45 | 7.28% |
Gross Profit Margin (%) | 50.01% | 47.81% | 2.20 | 4.60% |
In 2025, the cost of services decreased to 772.44 million THB, representing a reduction of 13.83 million THB or 1.76% compared to 2024. This decline was primarily driven by a organizational restructure, where some employees were transferred to a joint venture. Consequently, billable revenue from these personnel decreased, while associated employment costs dropped in a similar proportion. Additionally, the Company continued to improve operational efficiency through cost management and quality control.
The decrease in service costs amidst growing external revenue led to a strong increase in the Gross Profit Margin, which rose from 47.81% in 2024 to 50.01% in 2025. Total Gross Profit grew by 52.45 million THB to reach 772.84 million THB. This margin expansion reflects the Company’s focus on cost efficiency and personnel development to maximize shareholder returns.
Selling and Administrative Expenses
Item Description | 2025 | 2024 | Change | |
Million THB | Million THB | Million THB | % | |
Selling Expenses | 133.32 | 141.86 | (8.54) | -6.02% |
Administrative Expenses | 329.14 | 299.46 | 29.68 | 9.91% |
Total | 462.46 | 441.32 | 21.14 | 4.79% |
For the fiscal year 2025, total SG&A expenses were 462.46 million THB, an increase of 21.14 million THB or 4.79% year-on-year. The details are as follows:
Selling Expenses: Decreased by 6.02% to 133.32 million THB. This reduction reflects more efficient management of billable staff working man day towards the billable projects, business development budgets, marketing activities, and sales promotions.
Administrative Expenses: Increased by 9.91% to 329.14 million THB. This growth is consistent with the Group’s expansion, a larger asset base, and management hiring to support long-term growth.
Despite the planned increase in administrative costs for business expansion, the Group successfully controlled selling expenses and improved service cost efficiency. As a result, the overall SG&A increase of 4.79% remained manageable and did not hinder profitability. This enabled the Group to achieve record-high operating profit growth of 10.90% in 2025.
Financial Income and Finance Costs
Item Description | 2025 | 2024 | Change | |
Million THB | Million THB | Million THB | % | |
Financial Income | 5.43 | 4.58 | 0.85 | 18.56% |
Finance Costs | (6.84) | (7.08) | 0.24 | -3.39% |
Financial Income
In 2025, the Group reported financial income of 5.43 million THB, an increase of 0.85 million THB or 18.56% compared to 2024. This growth was primarily driven by higher interest income from bank deposits, which aligns with the Group's increased liquidity. Cash and cash equivalents rose to 594.14 million THB by the end of 2025, up from 530.20 million THB in the previous year.
Finance Costs
For the year 2025, finance costs totaled 6.84 million THB, a slight decrease of 0.24 million THB or 3.39% year-on-year. This reduction is a positive factor for the Company's profitability. The decrease was mainly due to lower interest expenses on lease liabilities, as the total lease liability balance was reduced through regular payments from 67.72 million THB in 2024 to 60.06 million THB in 2025.
The Group has demonstrated effective management of its financial activities by successfully generating returns from its available liquidity while simultaneously reducing financing burdens. This contributes to a robust financial structure and supports overall net profit growth.
Net Profit
Item Description | 2025 | 2024 | Change | |
Million THB | Million THB | Million THB | % | |
Total Net Profit | 347.29 | 313.83 | 33.46 | 10.66% |
Net Profit Margin (%) | 22.47% | 20.83% | 1.64% | 7.87% |
Non-controlling Interests | 6.56 | 12.72 | (6.16) | -48.43% |
Net Profit Attributable to Parent | 340.73 | 301.11 | 39.62 | 13.16% |
In 2025, amidst a challenging and uncertain economic environment, the Group demonstrated exceptional adaptability and management, achieving record-high financial results. Total net profit reached 347.29 million THB, representing an increase of 33.46 million THB or 10.66% compared to 313.83 million THB in 2024.
This robust growth in net profit resulted in an improved Net Profit Margin of 22.47%, up from 20.83% in the previous year. This success is attributed to enhanced operational efficiency and disciplined cost management. Furthermore, the net profit was significantly supported by a 29.69% reduction in income tax expenses, as the Group maximized tax benefits from Board of Investment (BOI) certificates.
When considering profitability specifically for the Company’s shareholders, Net Profit Attributable to the Parent reached 340.73 million THB, an increase of 39.62 million THB or 13.16% year-on-year. Beyond revenue expansion, this growth was bolstered by a significant reduction in non-controlling interests, which dropped to 6.56 million THB (a decrease of 48.43%). This followed the Company’s successful acquisition of the final tranche (15%) of Innoviz Solutions Company Limited in the first quarter of 2025, allowing the Group to realize a greater proportion of profits for its shareholders and create long-term value.
Liquidity & Capital Adequacy
4.1.3 Cash Flow Analysis
Description | 2025 | 2024 |
Million THB | Million THB | |
Net profit for the year | 347.29 | 313.83 |
Adjustments to reconcile profit to cash from operating activities | 2.03 | 6.65 |
Changes in operating assets and liabilities | (84.17) | 24.98 |
Cash paid for employee benefits | (2.01) | (1.10) |
Interest received | 5.61 | 4.67 |
Income tax paid, net of refunds | (31.04) | (43.85) |
Net cash generated from operating activities | 237.71 | 305.18 |
Net cash used in investing activities | (111.23) | (263.32) |
Net cash used in financing activities | (58.47) | (54.39) |
Effect of exchange rate changes on cash and cash equivalents | (4.42) | 2.61 |
Effect of exchange differences on translation of financial statements | 0.35 | 0.08 |
Net increase (decrease) in cash and cash equivalents | 63.94 | (9.84) |
Cash Flow from Operating Activities
For the fiscal year 2025, the Group reported net cash generated from operating activities totaling 237.71 million THB. This reflects a decrease compared to the 305.18 million THB achieved in 2024 (representing a decrease in cash receipts of 67.47 million THB), even though overall operating performance reached an all-time record high. The significant causes and factors for the changes in operating cash flows are as follows:
Net Profit Growth: The Group achieved a net profit of 347.29 million THB for the year 2025, an increase of 33.46 million THB from the 313.83 million THB recorded in 2024. This robust profit growth serves as a strong foundation for generating operational cash inflows for the business.
Adjustments to Reconcile Profit to Cash Receipts (Non-cash items): During the year, the Group adjusted for significant items that do not impact actual cash flow, including:
Description | 2025 | 2024 |
Million THB | Million THB | |
Income tax expense | 24.41 | 34.72 |
Depreciation and amortization | 22.95 | 22.61 |
Employee benefit expenses | 14.19 | 16.05 |
Allowance (reversal) for devaluation of work in progress | 0.23 | (2.99) |
Reversal of provision for project losses | (0.95) | (1.68) |
Share of profit from associates and joint ventures | (57.86) | (66.77) |
Others* | (0.94) | 4.71 |
Total adjustments to reconcile profit to cash receipts | 2.03 | 6.65 |
* Others include items such as reversal of provision for project warranties, finance income/costs, and unrealized foreign exchange losses.
Income Tax Expense: Decreased to 24.41 million THB (2024: 34.72 million THB). This was primarily due to the fully utilization of BOI tax benefit.
Depreciation and Amortization: Increased slightly to 22.95 million THB (2024: 22.61 million THB). This increase resulted from higher investment in computer equipment and various software programs to support new personnel and the Group's business expansion.
Share of Profit from Associates and Joint Ventures: Decreased to 57.86 million THB (2024: 66.77 million THB). This item must be deducted from net profit during the cash flow reconciliation, as it represents recognized profit based on investment proportions that have not yet been realized as actual cash during the fiscal year.
Changes in Working Capital: Fluctuations in operating assets and liabilities were the primary factor contributing to the decrease in net cash flow from operating activities in 2025. The key drivers include:
Increase in Trade and Other Current Receivables: This resulted in a decrease (or usage) of cash flow totalling 70.69 million THB. This increase is directly correlated with the Group’s revenue growth from customer base expansion and the rising volume of project engagements in Technology Adoption and Digital Transformation.
Decrease in Trade and Other Current Payables: This led to an increase in cash outflows (or a decrease in cash flow) of 15.25 million THB, reflecting the settlement of trade obligations according to normal payment cycles.
The decrease in operating cash flow for 2025 does not reflect a decline in performance or liquidity issues. Instead, it is the result of higher Working Capital Requirements necessitated by business and revenue expansion, particularly the growth in trade receivables. With a net operating cash flow that remains strongly positive at 237.71 million THB, the Group continues to demonstrate its strength and efficiency in converting profits into cash to fund working capital and support long-term growth.
Cash Flow from Investing Activities
Description | 2025 | 2024 |
Million THB | Million THB | |
Net cash paid for acquisition of subsidiaries | (147.17) | (230.86) |
Cash paid for development of intangible assets | (15.93) | (15.29) |
Cash received from (paid for) other current financial assets | 30.00 | (30.00) |
Cash received from dividends* | 30.41 | 16.26 |
Others** | (8.54) | (3.43) |
Net cash used in investing activities | (111.23) | (263.32) |
* Includes dividends from joint ventures and other non-current financial assets.
** Includes cash paid for building improvements, equipment, and net movements in restricted deposits and loans.
For the fiscal year 2025, the Group utilized net cash in investing activities totaling 111.23 million THB. This represents a significant decrease in cash outflows compared to the 263.32 million THB utilized in 2024 - a reduction of 152.09 million THB. The primary drivers and changes in investing activities are as follows:
Strategic Investments (Primary Cash Outflows): The most substantial cash outflow in this category was for the final installment (Tranche 3) to purchase a 15% stake in ordinary shares of Innoviz Solutions Company Limited (Innoviz), totaling 147.17 million THB. This acquisition completed the Group’s planned 100% ownership of Innoviz, decreasing from the 230.86 million THB paid for Tranche 2 in 2024. Additionally, the Group continued to invest 15.93 million THB in the development of intangible assets primarily computer software and platforms to enhance service quality and support business expansion.
Returns and Redemptions of Investments (Primary Cash Inflows): In 2025, the Company effectively generated cash inflows back into its operations from multiple sources:
Dividends from Joint Ventures: Received cash dividends from Orbit Digital Company Limited amounting to 28.94 million THB. This reflects a significant increase from 15.84 million THB in the previous year and underscores the joint venture's robust operating performance.
Redemptions of Investments and Loans: The Company received 30.00 million THB from the full redemption of other current financial assets and 5.00 million THB from the repayment of short-term loans provided to other companies.
Dividends from Long-term Investments: Received cash dividends from other non-current financial assets (venture capital funds) totaling 1.47 million THB, up from 0.42 million THB in the prior year.
Investing activities in 2025 highlight the Group’s entry into a Harvesting Period, where it is successfully realizing returns from previous strategic investment decisions, such as the increased dividends from its joint venture. Concurrently, the Company demonstrated exceptional cash management by completing its Merger and Acquisition (M&A) plan to reach 100% ownership as scheduled, utilizing operational cash flow and internal liquidity management effectively.
Cash Flow from Financing Activities
Description | 2025 | 2024 |
Million THB | Million THB | |
Dividend paid by the parent company | (43.99) | (41.53) |
Dividend paid by subsidiaries | (1.50) | (0.42) |
Payment of lease liabilities | (12.98) | (12.44) |
Net cash used in financing activities | (58.47) | (54.39) |
For the fiscal year 2025, the Group utilized net cash in financing activities totaling 58.47 million THB, representing a slight increase compared to the 54.39 million THB utilized in 2024. This cash utilization reflects the Company’s robust financial position, prioritizing shareholder returns and the fulfillment of standard business obligations. Key details are as follows:
Dividend Payments: The primary cash outflow in this category was the payment of dividends from the parent company based on 2024 perating results, amounting to 43.99 million THB (up from 41.53 million THB in the previous year) . This aligns with the Group’s 2024 performance, where net profit attributable to the parent company reached 301.11 million THB. Additionally, dividends paid by subsidiaries to non-controlling interests increased to 1.50 million THB. These payments demonstrate a strong capability to consistently generate profits and cash flow for distribution to investors.
Lease Liability Payments: The Group utilized 12.98 million THB to settle lease liabilities, such as office space and computer equipment. This figure is consistent with the 12.44 million THB paid in the prior year, reflecting the regular fulfillment of financial obligations.
Throughout 2025, the Group did not incur any additional interested bearing debt from financial institutions. Financing activities were focused entirely on capital structure management to support dividend payments and contractual lease obligations. This cash flow structure reaffirms the Group’s exceptionally high internal liquidity, allowing it to drive growth and provide shareholder returns through its own working capital while effectively maintaining interest-bearing debt at a minimal level.
4.1.4 Analysis of Key Financial Ratios
Items Description | Consolidated FS | |
2025 | 2024 | |
Profitability Ratios | ||
Gross Profit Margin (%) | 50.0% | 47.8% |
Net Profit Margin (%) | 22.3% | 20.7% |
Return on Investment Ratios | ||
Return on Assets (ROA) (%) | 13.5% | 12.7% |
Return on Equity (ROE) (%) | 16.9% | 16.1% |
Liquidity Ratios | ||
Current Ratio (times) | 4.13 | 3.64 |
Quick Ratio (times) | 3.84 | 3.34 |
Efficiency Ratios | ||
Trade Receivable Turnover (times) | 3.41 | 3.48 |
Average Collection Period (days) | 107.01 | 104.90 |
Trade Payable Turnover (times) | 23.27 | 20.91 |
Average Payment Period (days) | 15.68 | 17.45 |
Cash Cycle* (days) | 91.32 | 87.44 |
Capital Structure Ratio | ||
Debt to Equity (D/E) Ratio (times) | 0.24 | 0.25 |
Note*: The Group operates a consulting business in strategy and information technology, which does not maintain physical inventory. Therefore, the "Average Inventory Turnover Period" is not calculated. The Cash Cycle is calculated as the Average Collection Period minus the Average Payment Period.
Profitability Ratios: The Group demonstrated a significant improvement in profitability in 2025. The Gross Profit Margin increased from 47.8% in 2024 to 50.0% in 2025, reflecting exceptional efficiency in managing service costs and project deliveries. This growth in gross profit directly enhanced the bottom line, leading the Net Profit Margin to rise from 20.7% to 22.3%, underscoring strong profitability amidst revenue expansion.
Return on Investment: Following record-high net profits, the Group enhanced its efficiency in asset and equity utilization. The Return on Assets (ROA) increased to 13.5% (up from 12.7% in the previous year), and the Return on Equity (ROE) rose to reach 16.9% (up from 16.1%). These positive signals indicate the Company’s capability to manage capital effectively to generate worthwhile returns for shareholders.
Liquidity Ratios: The Group’s liquidity position remains highly robust and has improved from the previous year. The Current Ratio increased to 4.13 times (from 3.64 times), and the Quick Ratio rose to 3.84 times (from 3.34 times). This improvement was primarily supported by the growth of cash and cash equivalents, as well as trade receivables. Ratios at these levels indicate that the Company has more than sufficient current assets to cover its short-term liabilities comfortably.
Asset Turnover & Cash Cycle: In terms of working capital management efficiency, the Average Collection Period slightly increased from 104.90 days to 107.01 days (Trade Receivable Turnover decreased from 3.48 times to 3.41 times), which is consistent with the increased volume of large-scale projects. Meanwhile, the Average Payment Period shortened from 17.45 days to 15.68 days. Consequently, the Cash Cycle increased slightly from 87.44 days to 91.32 days. However, given the high level of cash liquidity on hand, this cash cycle level does not impact business operations.
Capital Structure Ratio: The Group continues to maintain excellent financial discipline. The Debt-to-Equity (D/E) Ratio decreased from 0.25 times in 2024 to only 0.24 times in 2025, reflecting a very low-leverage capital structure. Business expansion is primarily funded through internal cash flow and growth in retained earnings, providing the Company with high flexibility and very low financial risk.
Asset Management Capability
4.1.2 Analysis of Financial Position
Assets
Item Description | 2025 | 2024 | Change | |||
Million THB | % | Million THB | % | Million THB | % | |
Cash and Cash Equivalents | 594.14 | 22.46% | 530.20 | 21.19% | 63.94 | 12.06% |
Other Current Financial Assets | - | 0.00% | 30.00 | 1.20% | (30.00) | -100.00% |
Restricted Bank Deposits (Current) | 9.76 | 0.37% | 0.13 | 0.01% | 9.63 | 7407.69% |
Trade and Other Current Receivables | 342.13 | 12.93% | 271.62 | 10.86% | 70.51 | 25.96% |
Contract Assets - Current | 320.02 | 12.10% | 319.93 | 12.79% | 0.09 | 0.03% |
Short-term Loans to Other Companies | - | 0.00% | 5.00 | 0.20% | (5.00) | -100.00% |
Costs to Obtain Contracts with Customers | 0.64 | 0.02% | 0.11 | 0.00% | 0.53 | 481.82% |
Service Work in Progress | 17.61 | 0.67% | 26.01 | 1.04% | (8.40) | -32.30% |
Current Income Tax Assets | 1.21 | 0.05% | 2.95 | 0.12% | (1.74) | -58.98% |
Prior period Income Tax Assets | 0.82 | 0.03% | 0.45 | 0.02% | 0.37 | 82.22% |
Other Current Assets | 11.59 | 0.44% | 4.14 | 0.17% | 7.45 | 179.95% |
Total Current Assets | 1,297.92 | 49.06% | 1,190.54 | 47.58% | 107.38 | 9.02% |
Restricted Bank Deposits (Non-current) | 9.76 | 0.37% | 9.46 | 0.38% | 0.30 | 3.17% |
Other Non-current Financial Assets | 34.44 | 1.30% | 37.67 | 1.51% | (3.23) | -8.57% |
Investments in Associates and JVs | 183.17 | 6.92% | 158.19 | 6.32% | 24.98 | 15.79% |
Building Improvements and Equipment | 35.68 | 1.35% | 43.76 | 1.75% | (8.08) | -18.46% |
Right-of-use Assets | 52.11 | 1.97% | 61.12 | 2.44% | (9.01) | -14.74% |
Intangible Assets | 41.69 | 1.58% | 26.37 | 1.05% | 15.32 | 58.10% |
Goodwill | 945.88 | 35.76% | 945.88 | 37.81% | - | 0.00% |
Deferred Tax Assets | 28.13 | 1.06% | 21.07 | 0.84% | 7.06 | 33.51% |
Other Non-current Assets | 16.60 | 0.63% | 7.88 | 0.31% | 8.72 | 110.66% |
Total Non-current Assets | 1,347.45 | 50.94% | 1,311.40 | 52.42% | 36.06 | 2.75% |
Total Assets | 2,645.38 | 100.00% | 2,501.94 | 100.00% | 143.44 | 5.73% |
As of December 31, 2025, the Group's total assets amounted to 2,645.38 million THB, representing an increase of 143.44 million THB or 5.73% from 2024. Current assets accounted for 49.06%, while non-current assets represented 50.94% of total assets. Key changes in asset items are as follows:
Cash and Cash Equivalents: Increased by 63.94 million THB (+12.06%) to 594.14 million THB, reflecting robust liquidity and effective operational cash flow management.
Trade and Other Current Receivables: Increased by 70.51 million THB (+25.96%) to 342.13 million THB, consistent with the expansion of service revenue and overall business growth.
Other Current Financial Assets and Short-term Loans: Decreased to zero as these investments were fully redeemed and loans were repaid during the year.
Investments in Associates and Joint Ventures: Increased by 24.98 million THB (+15.79%) to 183.17 million THB, primarily due to the recognition of profit sharing from joint ventures with strong performance.
Intangible Assets: Saw a significant increase of 15.32 million THB (+58.10%) to 41.69 million THB, reflecting the Group’s commitment to investing in technology, software, and digital platform development.
Goodwill: Remained at 945.88 million THB (accounting for 35.76% of total assets) from previous subsidiary acquisitions. Management’s impairment testing confirmed that the recoverable amount remains higher than the carrying value. Therefore, there is no indicator for the impairment of goodwill balance.
Overall, the Group’s asset structure shows continuous growth and remains well-balanced. High liquidity levels ensure the Group is well-positioned to support future technological investments and business expansion.
Liabilities and Shareholders' Equity
Item Description | 2025 | 2024 | Change | |||
Million THB | % | Million THB | % | Million THB | % | |
Liabilities | ||||||
Bank overdrafts | - | 0.00% | - | 0.00% | - | 0.00% |
Trade and other current payables | 158.08 | 5.98% | 174.71 | 6.98% | (16.63) | -9.52% |
Contract liabilities - current | 115.74 | 4.38% | 114.98 | 4.59% | 0.76 | 0.66% |
Current income tax payables | 0.88 | 0.03% | 4.52 | 0.18% | (3.64) | -80.53% |
Provision for project warranties | 5.47 | 0.21% | 7.25 | 0.29% | (1.78) | -24.55% |
Other current liabilities | 23.55 | 0.89% | 14.22 | 0.57% | 9.33 | 65.61% |
Lease liabilities | 60.06 | 2.27% | 67.73 | 2.71% | (7.67) | -11.32% |
Provision for employee benefits | 135.69 | 5.13% | 110.94 | 4.43% | 24.75 | 22.31% |
Provision for decommissioning | 1.78 | 0.07% | 1.73 | 0.07% | 0.05 | 2.89% |
Total Liabilities | 501.25 | 18.95% | 496.08 | 19.83% | 5.17 | 1.04% |
Shareholders' Equity | ||||||
Issued and paid-up share capital | 100.01 | 3.78% | 100.01 | 4.00% | - | 0.00% |
Share premium on ordinary shares | 1,487.83 | 56.24% | 1,487.83 | 59.47% | - | 0.00% |
Other surpluses | 15.70 | 0.59% | 15.70 | 0.63% | - | 0.00% |
Deficit from changes in ownership interests in subsidiaries | (337.39) | -12.75% | (211.23) | -8.44% | (126.16) | 59.73% |
Retained earnings (Appropriated & Unappropriated) | 868.61 | 32.83% | 585.78 | 23.41% | 282.83 | 48.28% |
Other components of equity | (2.48) | -0.09% | 0.07 | 0.00% | (2.55) | -3642.86% |
Equity Attributable to the Parent | 2,132.28 | 80.60% | 1,978.16 | 79.06% | 154.12 | 7.79% |
Non-controlling interests | 11.85 | 0.45% | 27.70 | 1.11% | (15.85) | -57.22% |
Total Shareholders' Equity | 2,144.13 | 81.05% | 2,005.86 | 80.17% | 138.27 | 6.89% |
Total Liabilities and Equity | 2,645.38 | 100.00% | 2,501.94 | 100.00% | 143.44 | 5.73% |
As of December 31, 2025, the Group reported total liabilities and shareholders' equity of 2,645.38 million THB, representing a growth of 143.44 million THB or 5.73% from 2024. The capital structure remains exceptionally robust, with total liabilities accounting for only 18.95% of the total, while shareholders' equity represents the remaining 81.05%
Liabilities Section: Total liabilities experienced a minor increase of 5.17 million THB (+1.04%), reaching 501.25 million THB. The most significant change was the provision for employee benefits, which rose by 24.75 million THB to a total of 135.69 million THB. This increase is consistent with the recognition of both past and current service costs, as well as actuarial losses. Concurrently, the Company successfully reduced its debt burden in several areas, including trade and other current payables, which decreased by 16.63 million THB, and lease liabilities, which dropped by 7.67 million THB due to continuous scheduled payments throughout the year. The majority of the Company's liabilities remain current trade-related payables and employee obligations, with no reliance on interested bearing debt.
Shareholders' Equity Section: Total shareholders' equity demonstrated strong growth of 138.27 million THB (+6.89%), totaling 2,144.13 million THB. The primary driver was the growth in retained earnings, which increased by 282.83 million THB to reach 868.61 million THB. This growth is a direct result of the Company achieving a record-breaking net profit in 2025.
Furthermore, there was a significant item in terms of accounting: the deficit from changes in ownership interests in subsidiaries, which showed an increased negative balance of 126.16 million THB, reaching (337.39) million THB. This resulted from two major Group restructurings (1) The final 15% acquisition of shares in Innoviz Solutions Company Limited (Innoviz), valued at 147.17 million THB, bringing the Group’s total ownership to 100%. (2) An additional 2.5% share transfer within a subsidiary for Bluebik Titans Company Limited, increasing the shareholding proportion to 80%.
While these accounting entries technically reduce the equity balance, the business implication is a unlocking of value, allowing the parent company to recognize 100% of future profits from Innoviz. Consequently, non-controlling interests decreased significantly to only 11.85 million THB.
The Company’s financial structure is exceptionally stable, maintained by a very low Debt-to-Equity (D/E) Ratio. Asset expansion has been primarily supported by retained earnings generated from operations. This underscores the Company's strong internal capability to generate cash flow to support both dividend payments and future investment expansions.
Other Analysis
| Title | Description |
|---|---|
| Others | Audit Fee The Group, which includes the Company, its subsidiaries, and its associates, incurred a total audit fee of 3.81 million THB for the fiscal year 2025. Dividend Payment The Board of Directors’ Meeting No. 1/2026, held on February 19, 2025, passed a resolution to propose a cash dividend payment of 0.48 THB per share to shareholders of record (for 200,015,474 shares). This reflects a total dividend distribution not exceeding 96.01 million THB. The dividend will be paid to shareholders listed in the share register as of April 30, 2026. This proposal will be submitted for approval at the 2026 Annual General Meeting of Shareholders (AGM) on April 21, 2026, with the payment scheduled for May 20, 2026. Subsequent Events Beyond the proposed dividend, the Group has implemented several strategic initiatives to support business expansion in 2026:
|
Debt Securities with Financial Ratio Requirements
Debt Securities with Financial Ratio Requirements Issued?
No
Factors That May Affect Financial Condition
Factors or Incidents That May Materially Affect Financial Condition
The Thai and global economic conditions, which remain in a state of volatile recovery, combined with rapid technological advancements, are key factors driving digital transformation to shift from an "option" to a "Survival Strategy" for large organizations. This is particularly evident in the demand for the organizational application of Generative AI and Agentic AI (AI-Led Enterprise Transformation), as well as cloud systems and cybersecurity, which have become increasingly important, resulting in a continuous situation where the demand for specialized consultants exceeds market supply (Demand exceeds Supply).
However, amidst the increasingly complex needs of business organizations and the requirement for faster and more precise delivery than before, the Group has elevated its working structure (Structure Transformation) to respond to technology trends by launching "Bluebik Digital Company Limited". This entity consolidates personnel for centralization and enhances capabilities in Digital Excellence & Delivery (DX), as well as Research and Development (R&D) under the concept “We don’t deliver systems. We deliver outcomes.”. This restructuring provides the Group with full potential and readiness to accept large-scale projects valued at 100 million THB or more, both domestically and internationally
The Group continues to drive its business expansion plans, setting an operating results growth target for 2026 at 20 percent, supported by a strong total backlog (including joint ventures) of 952 million THB as of the end of 2025. Of this total, more than 777 million THB is expected to be delivered and recognized as revenue within 2026. The Company has a strategic plan to support such growth, consisting of:
Workforce Expansion: There is a plan to increase the number of technology specialists at Bluebik Digital by approximately 10 percent within 2026 to support the increasing volume of work and large-scale projects.
Liquidity Enhancement: The Company has prepared its funding sources by opening an additional reserve credit line with financial institutions valued at 100 million THB in early 2026 to serve as working capital and a liquidity-enhancing mechanism for aggressive business expansion
International Market Expansion: Proactively entering markets with high demand for digital transformation by leveraging the Group’s strengths in IT personnel potential and competitive service cost advantages on a global level.
In the long term, the Group is committed to becoming a Strategic Tech Enabler by creating global business alliances to co-develop new products and solutions. This strategy will not only help penetrate new potential customer segments but will also increase the proportion of recurring income for the Group. Additionally, the Company is planning and preparing to bring subsidiaries to list on the stock exchange (IPO) in the future to create sustainable growth.